Chart.js
-
Charts are far better for displaying data visually than tables, They’re easier to look at and convey data quickly.
-
The first thing we need to download Chart.js. Copy the Chart.min.js out of the unzipped folder and into the directory you’ll be working in. Then import the script inside html file:
<script src='Chart.min.js'></script>
Canvas:
-
The
<canvas>element has only two attributes, width and height. These are both optional and can also be set using DOM properties. When no width and height attributes are specified, the canvas will initially be 300 pixels wide and 150 pixels high. -
Note: If your renderings seem distorted, try specifying your width and height attributes explicitly in the
<canvas>attributes, and not using CSS. -
The
<canvas>element can be styled just like any normal image (margin, border, background…). -
The canvas is initially blank. To display something, a script first needs to access the rendering context and draw on it. The
<canvas>element has a method calledgetContext(), used to obtain the rendering context and its drawing functions. getContext() takes one parameter, the type of context. For 2D graphics you specify “2d” . -
Drawing a line chart:

To draw a line chart we need to create a canvas element in our HTML in which Chart.js can draw our chart.
<canvas id="buyers" width="600" height="400"></canvas>
Next, we need to write a script that will retrieve the context of the canvas inside a <script> tag.
var buyers = document.getElementById('buyers').getContext('2d');
new Chart(buyers).Line(buyerData);
Inside the same script tags we need to create our data, in this instance it’s an object that contains labels for the base of our chart and datasets to describe the values on the chart.
var buyerData = {
` labels : [“January”,”February”,”March”,”April”,”May”,”June”],
datasets : [
{
fillColor : “rgba(172,194,132,0.4)”,
strokeColor : “#ACC26D”,
pointColor : “#fff”,
pointStrokeColor : “#9DB86D”,
data : [203,156,99,251,305,247]
}
]
}`
- Drawing a pie chart:

First, we need the <canvas> element.
Next, we need to get the context and to instantiate the chart inside a container.
new Chart(countries).Pie(pieData, pieOptions);
Next we need to create the data. This data is a little different to the line chart we just need to supply a value and a color for each section:
Example:
var pieData = [
` {
value: 20,
color:”#878BB6”
},
{
value : 40,
color : “#4ACAB4”
},
{
value : 10,
color : “#FF8153”
},
];`
Now, immediately after the pieData we’ll add our options:
var pieOptions = {
` segmentShowStroke : false,
animateScale : true
}`
-
These options to:
- remove the stroke from the segments.
- animate the scale of the pie so that it zooms out from nothing.
-
Drawing a bar chart:
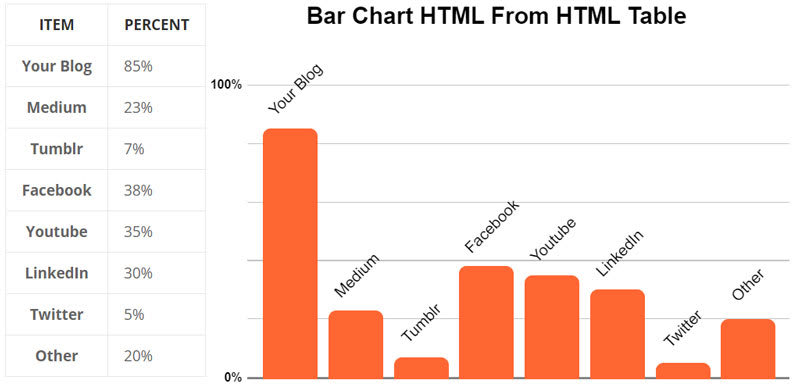
The syntax for the bar chart is very similar to the line chart.
-
First, we add the canvas element.
-
Next, we retrieve the element and create the graph.
new Chart(income).Bar(barData);
- And finally, we add in the bar chart’s data.
Example:
var barData = {
` labels : [“January”,”February”,”March”,”April”,”May”,”June”],
datasets : [
{
fillColor : “#48A497”,
strokeColor : “#48A4D1”,
data : [456,479,324,569,702,600]
},
{
fillColor : “rgba(73,188,170,0.4)”,
strokeColor : “rgba(72,174,209,0.4)”,
data : [364,504,605,400,345,320]
}
]
}`
Drawing rectangles:
There are three functions that draw rectangles on the canvas:
- fillRect(x, y, width, height): Draws a filled rectangle.
- strokeRect(x, y, width, height): Draws a rectangular outline.
- clearRect(x, y, width, height): Clears the specified rectangular area, making it fully transparent.
Each of these three functions takes the same parameters. x and y specify the position on the canvas (relative to the origin) of the top-left corner of the rectangle. width and height provide the rectangle’s size.
Drawing paths:
A path is a list of points, connected by segments of lines that can be of different shapes, curved or not, of different width and of different color.
-
First, you create the path.Then you use drawing commands to draw into the path. Once the path has been created, you can stroke or fill the path to render it. Here are the functions used to perform these steps:
-
beginPath(): Creates a new path. Once created, future drawing commands are directed into the path and used to build the path up. -
closePath(): Adds a straight line to the path, going to the start of the current sub-path. -
stroke(): Draws the shape by stroking its outline. -
fill(): Draws a solid shape by filling the path’s content area.
-
-
The second step is calling the methods that actually specify the paths to be drawn.
-
The third, and an optional step, is to call closePath(). This method tries to close the shape by drawing a straight line from the current point to the start.
-
If we want to apply colors to a shape, there are two important properties we can use:
fillStyle: Sets the style used when filling shapes.strokeStyle: Sets the style for shapes’ outlines.
Drawing text:
The canvas rendering context provides two methods to render text:
-
fillText(text, x, y [, maxWidth]): Fills a given text at the given (x,y) position. Optionally with a maximum width to draw. -
strokeText(text, x, y [, maxWidth]): Strokes a given text at the given (x,y) position. Optionally with a maximum width to draw.